Debugging Apps
Background: Port Forwarding and Debugging
Just as we did before with remote shelling into our pods, we can also set up a port-forward between our local machine and our pod. The is useful for operations like connecting to a database running in a pod, viewing an administrative web interface we don’t want to expose to the public, or, in our case, attaching a debugger to the JVM running our application server.
You can read more about port-forwarding from the developer documentation.
By port forwarding the debugging port for the application server, we can attach the debugger from our IDE and actually step through the code in the pod as it is running in real time. By default EAP is not in debug mode, therefore we first need to turn on the debug ports
Exercise: Enabling Debugging in EAP on OpenShift
It is very simple to turn on debugging. The EAP S2I container we are using is looking for an environment variable to control whether or not to enable the debug port. All we need to do is set an environment variable for the deployment.
oc set env dc/mlbparks DEBUG=trueThis will force a redeploy of our MLBparks pod, this time with the JDWT transport enabled and serving on port 8787.
Whilst we can connect to a Pod directly to debug it, when there is only one instance of a Pod running it can be convenient to setup port-forwarding through a Service (since Pod names change but the name of the Service is static). See Exercise: Port-Forwarding from the pod to our local machine
Port-Forwarding through a Service to our local machine
Let’s take a closer look at the service in question:
oc describe svc/mlbparksName: mlbparks
Namespace: workshop
Labels: app=workshop
component=mlbparks
createdBy=mlbparks-template
role=backend
type=parksmap-backend
Annotations: openshift.io/generated-by: OpenShiftNewApp
service.alpha.openshift.io/dependencies: [{"name":"mongodb-mlbparks","namespace":"","kind":"Service"}]
Selector: deploymentConfig=mlbparks
Type: ClusterIP
IP Families: <none>
IP: 172.21.206.162
IPs: <none>
Port: 8080-tcp 8080/TCP
TargetPort: 8080/TCP
Endpoints: 172.30.18.203:8080
Port: 8787-tcp 8787/TCP
TargetPort: 8787/TCP
Endpoints: 172.30.18.203:8787
Session Affinity: None
Events: <none>Now that our deployment is setup for debugging, it will be listening on port 8787. We’ll setup port-forwarding to that port on the service (which will in turn forward on to the pod)
oc port-forward svc/mlbparks 8787:8787So now when we connect on localhost:8787 it will get forwarded to the mlbparks instance running in the pod.
port-forwarding is only active as long as the oc port-forward command is allowed to run. Since we run it in the foreground, we are able to stop port-forwarding by hitting CTRL+c (or CMD+c on a Mac)
|
Now all we need to do is find a debugger to connect on that port
Attaching a Remote Debugger
In order to debug the source code you can either use your IDE of choice (instructions for IntelliJ below) or you can debug from the Console. Pick the appropriate tab for your situation.
-
From the root of the mlbparks git repo that you cloned locally, run the following command:
jdb -sourcepath $(pwd)/src/main/java -attach localhost:8787Set uncaught java.lang.Throwable Set deferred uncaught java.lang.Throwable Initializing jdb ... > -
Next, set a breakpoint in the
BackendControllerclass by issuing this command in the debugger:stop in com.openshift.evg.roadshow.rest.BackendController.getSet breakpoint com.openshift.evg.roadshow.rest.BackendController.get -
Navigate to the mlbparks url (you can use curl from a shell or just paste the url in your browser)
-
Your debugger should now be "breaked" at the first line of the
BackendController.getmethodBreakpoint hit: "thread=default task-4", com.openshift.evg.roadshow.rest.BackendController.get(), line=23 bci=0 23 return new Backend("mlbparks", "AMAZING MLB Parks", new Coordinates("39.82", "-98.57"), 5); -
Feel free to play around a bit with the jdb commands. Some examples include:
-
list: To see fuller view of source around the breakpoint -
where: To dump the thread’s current stack -
print: Print value of variables, such asprint thisto see the BackendController as string -
cont: Continue execution of the program
-
Setting up remote debugging is quite easy in IntelliJ. First edit the run/debug configurations. Under the Run menu (ALT+u), choose edit configurations. This will bring up the new configuration dialog.
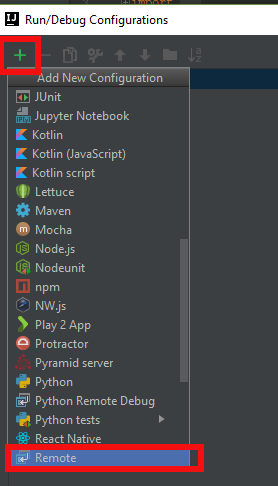
Click the plus in the top left corner, scroll down, and choose remote.

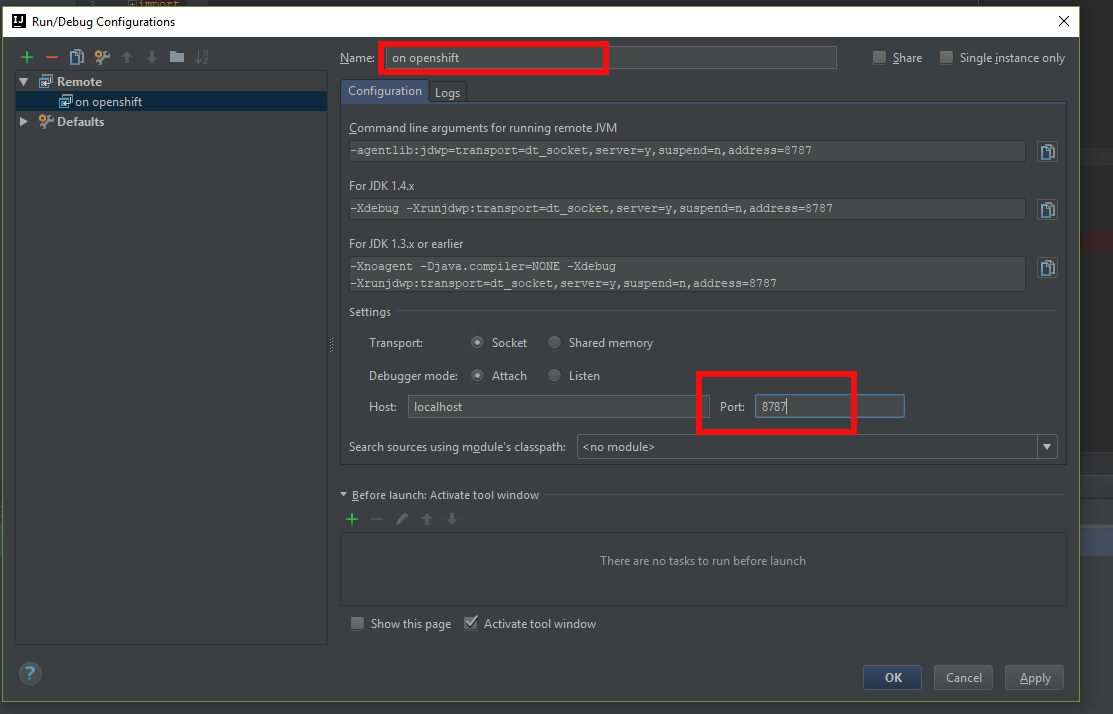
On the resulting dialog page, change the name at the top to "on OpenShift" or whatever is informative to you. Then towards the bottom right, change the port number to 8787. When you have done that click "OK".

Now when you click the Debug icon in IntelliJ, it will open the debugger and attach to JVM in the pod on OpenShift. Go ahead and set a break point in any class you want and it will do normal debugging - just like you know and love!
Exercise: Port-Forwarding from the pod to our local machine
It is quite simple to do port-forwarding.
First get the pods:
oc get podsNAME READY STATUS RESTARTS AGE
mlbparks-1-build 0/1 Completed 0 4d
mlbparks-1-deploy 0/1 Completed 0 4d
mlbparks-1-hook-post 0/1 Completed 0 4d
mlbparks-2-build 0/1 Completed 0 10m
mlbparks-2-deploy 0/1 Completed 0 9m49s
mlbparks-2-hook-post 0/1 Completed 0 8m59s
mlbparks-3-deploy 1/1 Running 0 25s
mlbparks-3-hcd8g 0/1 Running 0 10s
...Now we can set to set up the port-forward:
oc port-forward mlbparks-3-hcd8g 8787:8787We said to port-forward from port 8787 on the pod to 8787 on the local machine. Now we can attach a remote debugger as outlined here.