Cost Analysis#
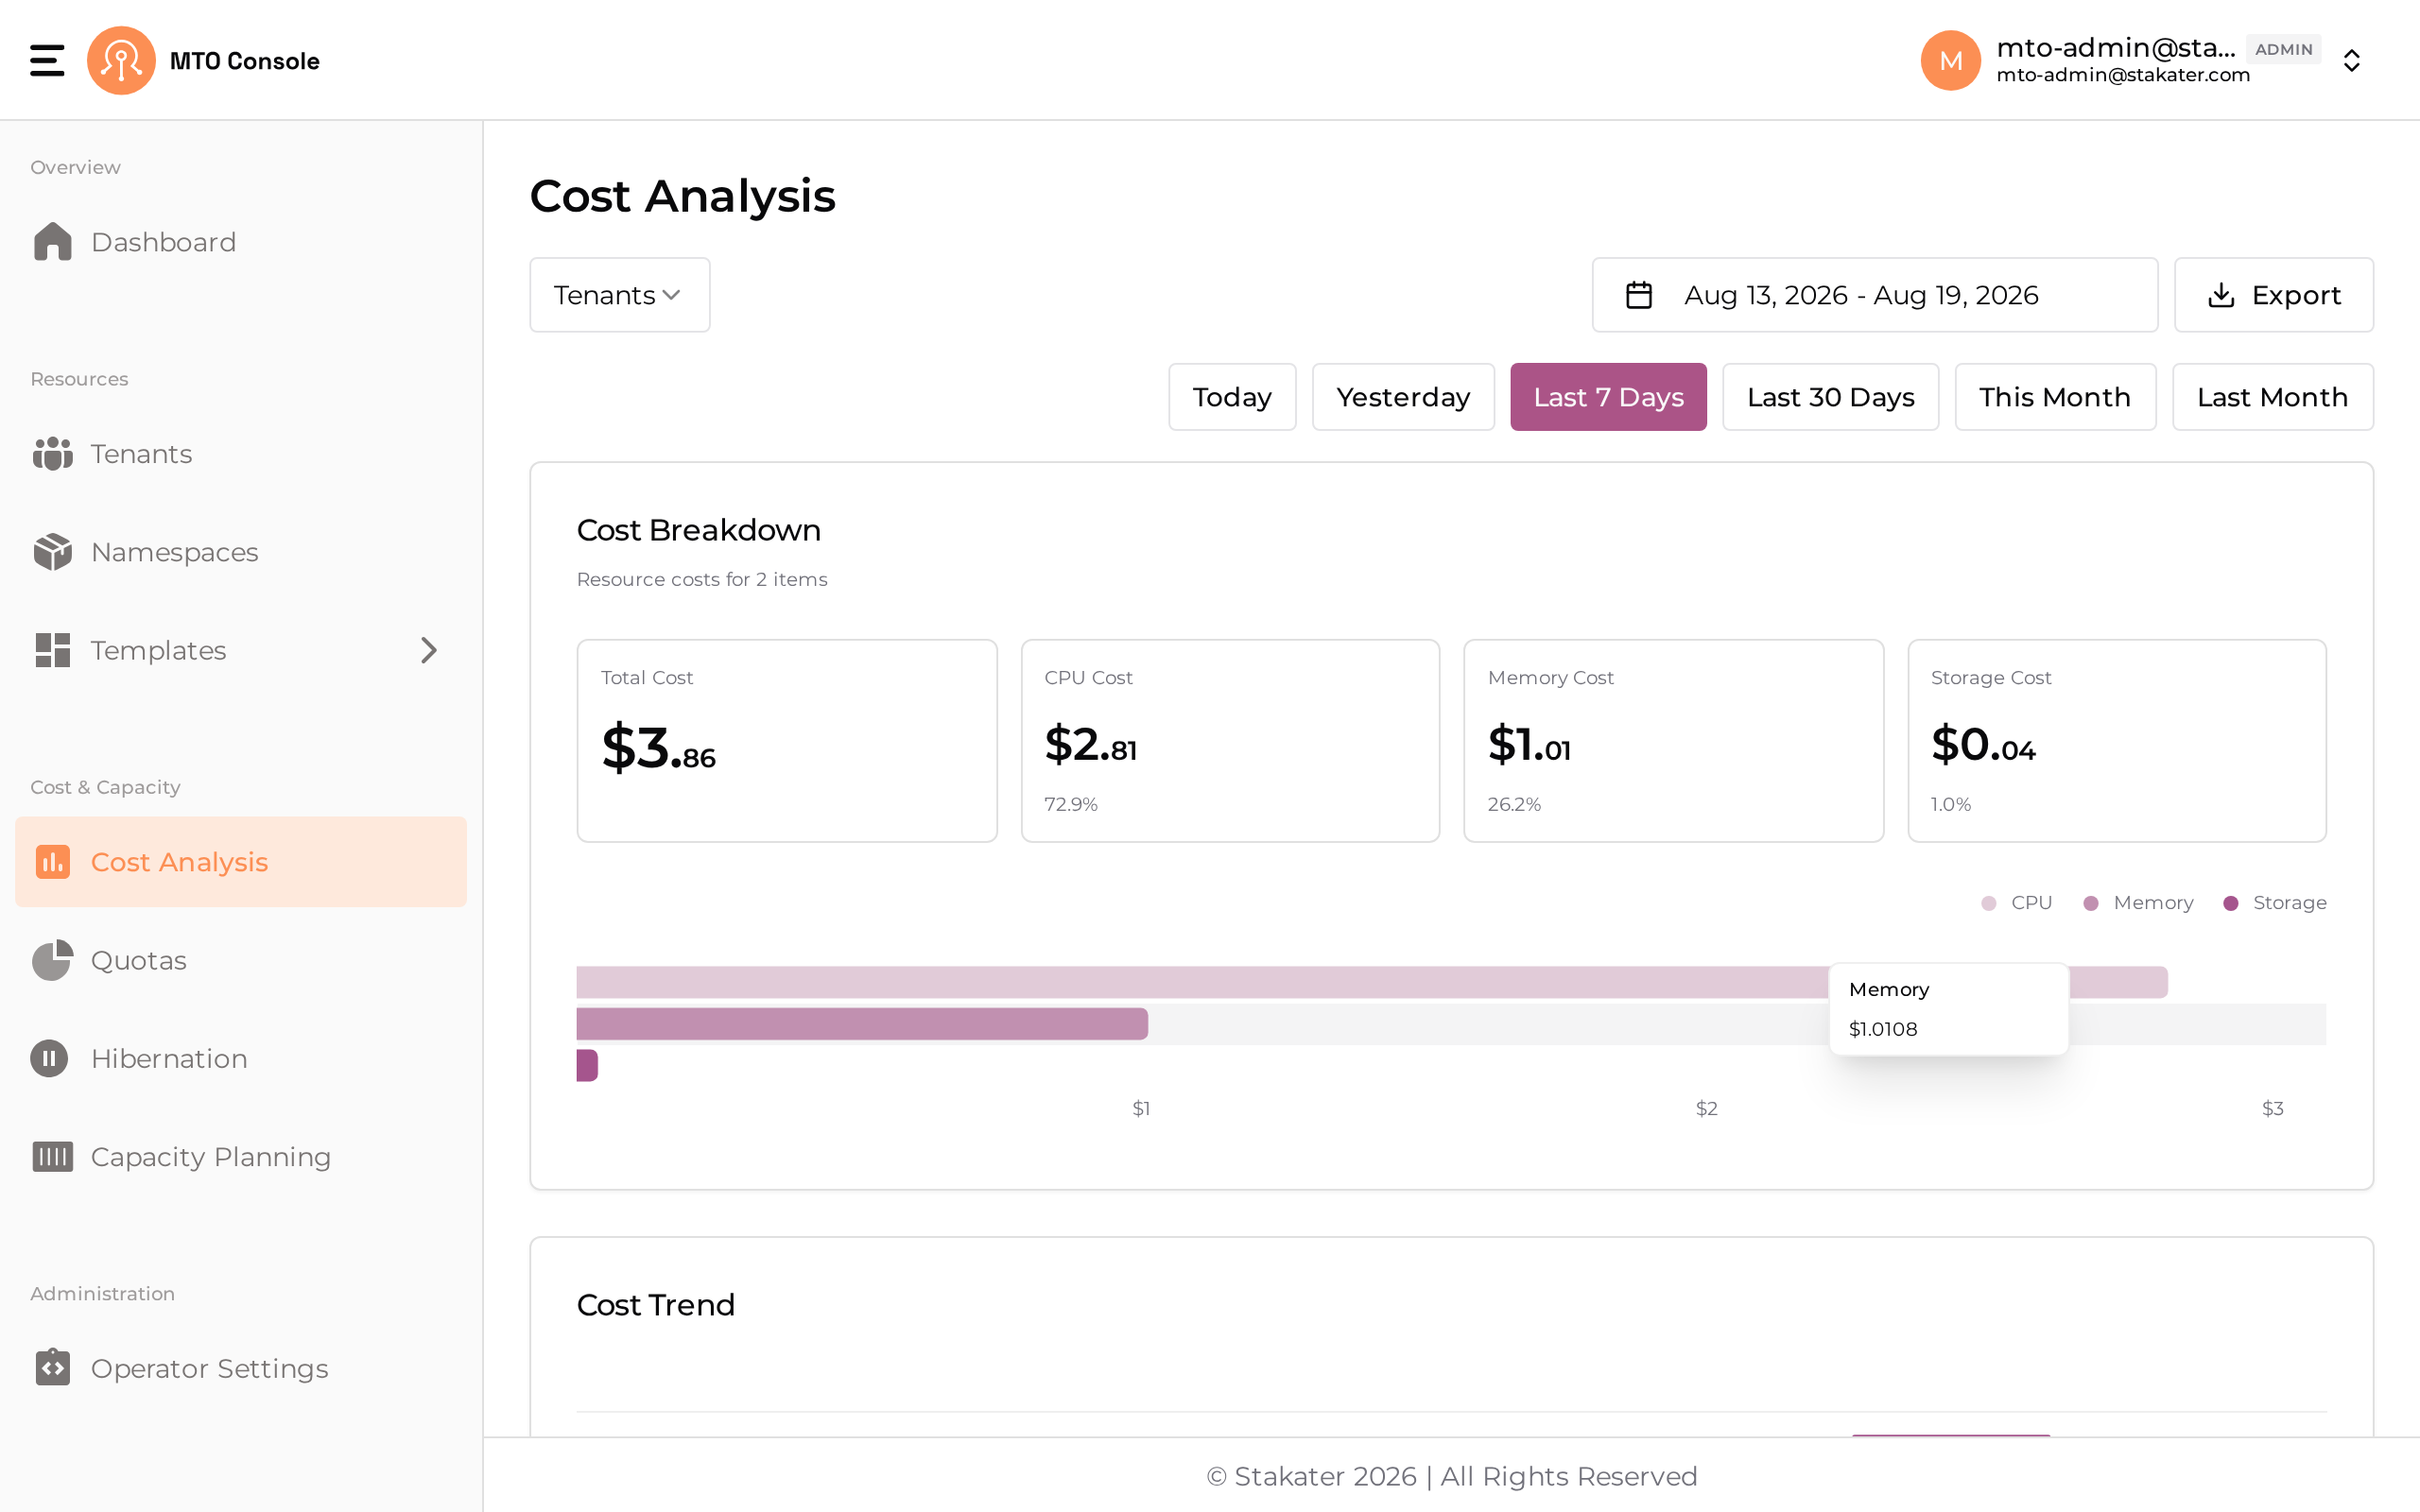
Most Kubernetes cost discussions stall in the same place: the bill is one number, and nobody can say which team caused it. Cost Analysis answers that question directly — what each tenant and each namespace consumed, and what it cost.
How the number is produced#
MTO does not estimate from node count. It measures:
- Sampled — Prometheus and
kube-state-metricsrecord actual resource usage and requests per namespace over time. - Aggregated — usage is rolled up to the tenant, because the tenant is the unit of ownership. Every namespace MTO manages already belongs to exactly one tenant.
- Priced — OpenCost applies rates to the sampled usage. For public-cloud clusters, MTO can use provider pricing so the figures track what you are actually billed. See AWS Pricing and Azure Pricing.
- Stored — results are written to MTO's PostgreSQL instance, so history survives Prometheus retention and you can compare this month against the last.
Why the tenant boundary makes this correct#
Cost attribution in Kubernetes usually depends on a tagging or labelling convention that someone has to apply and nobody fully applies. Attribution is then only as good as the discipline behind it.
MTO does not depend on that discipline. A namespace exists because a tenant declared it, and MTO stamps stakater.com/tenant on every namespace it manages. There is no unattributed remainder to argue about, and no separate tagging scheme to maintain alongside the tenant model.
Reading the view#
- Filter by tenant, namespace or time range to move between the roll-up and the detail. Start at the tenant level to see who is expensive, then drop into namespaces to see why.
- Compare periods to separate a real trend from a spike — a staging environment that doubled last week is a different conversation from one that has grown every month.
- Look at requests against usage. A namespace whose cost is driven by requests it never uses is the cheapest saving available: reduce the request, or hibernate the environment.
What it is used for#
Showback. Give each team its own consumption, in money. This is usually enough to change behaviour on its own — teams reduce oversized requests once the number has their name on it.
Chargeback. Bill internal departments or external customers from measured consumption instead of an allocation formula. Because a customer is a tenant, cost-to-serve is a figure you read rather than model.
Capacity conversations. When a team asks for more quota, the request can be weighed against what it already consumes. See Capacity Planning for the supply side.
Proving savings. Hibernation's effect shows up here — a non-production tenant asleep at nights and weekends is visible as a lower cost, not a claim. See Hibernation.
Enabling it#
Cost Analysis is part of the FinOps stack the Pilot controller provisions. Enable it in the IntegrationConfig:
  components:
    console: true
    showback: true
See Dashboard for the full set of console components and their ingress configuration.
Next#
- Capacity Planning — what the cluster provides against what is committed
- Hibernation — cut the cost of idle environments
- Tenants — the boundary the cost is attributed to